"Hybrid SaaS"
KO-Detect Pro
[AI-Facility Safety Inspection Solution]
"Download AI engine and solution directly to your PC"
Store data on your PC, only updates online.
Easily download and use anywhere in the world.
What is Digital Safety Inspection?
A smart way to thoroughly analyze facilities using AI and data, and manage them continuously without cost burden. It's an advanced next-generation management method with AI, evolving from the traditional human eye-dependent approach.
Transform your work to be easy, fast, and precise at minimal cost through digital safety inspection
Advantages of Digital Safety Inspection Transformation
Safety
Ensuring worker safety through remote inspection
AI
Automation of large-scale data analysis
Data Technology
Data-based quantification of damage volumes
Document Generation Technology
Automation of report generation
Time Series Analysis
Trend analysis through image comparison
This is how it changes with KO-Detect Pro introduction.
| Existing Safety Inspection | Digital Safety Inspection | ||
|---|---|---|---|
| Economy | Inspection Method | Human-based | Ko-Detect Pro |
| Inspection Period | 2 months (visual inspection) | 3 weeks (visual inspection) | |
| Inspection Cost | 110 million won | 11 million won (+20 million won) | |
| Process | Access Method | Land route, rope, heavy equipment, barge | Camera (drone, scanner, robot) |
| Damage Verification | Visual (subjective judgment) | Image (AI analysis) | |
| Classification Method | A3 paper drawing (location/type/shape) | Photo positioning (Photo Positioning) | |
| Recording Method | A3 paper drawing → CAD | Image-based drawing | |
| Statistics Method | CAD → Excel (damage type/size) | DB linked generation (CAD/Excel/Word) | |
| Evaluation Scope | Grade determination by management section (expert judgment) | ||
| Reporting Method | Document (CAD/HWP) → Storage device, binding | Project file (Ko-Detect Pro) | |
| History Management | External storage device (USB) | Project file management | |
Economy
Process
※ Comparison based on final deliverables including inspection and reports for 1km bridge visual inspection
Inspection Period
Inspection Cost
Risk
Detection Rate
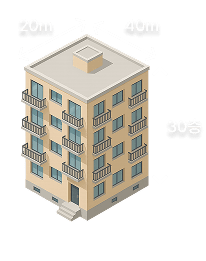
Apartment Inspection Case
- ▸Cost Reduction: 3 million won → 1.25 million won (analysis cost)
- ▸Shooting Area: 72,000 ㎡
- ▸Expected Photos: 2,600 (0.3mm crack survey, 20% overlap)
- ▸Analysis Time: AI analysis 0.9 days (30 seconds per 8K image)
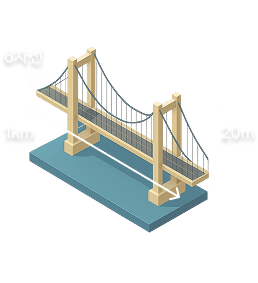
Bridge Inspection Case
- ▸Cost Reduction: 110 million won → 11 million won (analysis cost)
- ▸Shooting Area: 52,000 ㎡
- ▸Expected Photos: 22,600 (0.1mm crack survey, 60% overlap)
- ▸Analysis Time: AI analysis 7.8 days (30 seconds per 8K image)
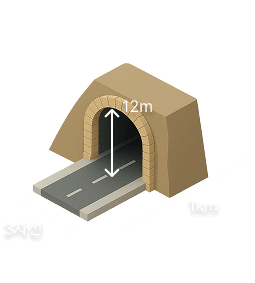
Tunnel Inspection Case
- ▸Cost Reduction: 58 million won → 1 million won (analysis cost)
- ▸Shooting Area: 31,000 ㎡
- ▸Expected Photos: 2,150 (0.1mm crack survey, 0% overlap)
- ▸Analysis Time: AI analysis 0.75 days (30 seconds per 8K image)
KO-Detect Pro's Specialized Solution Features
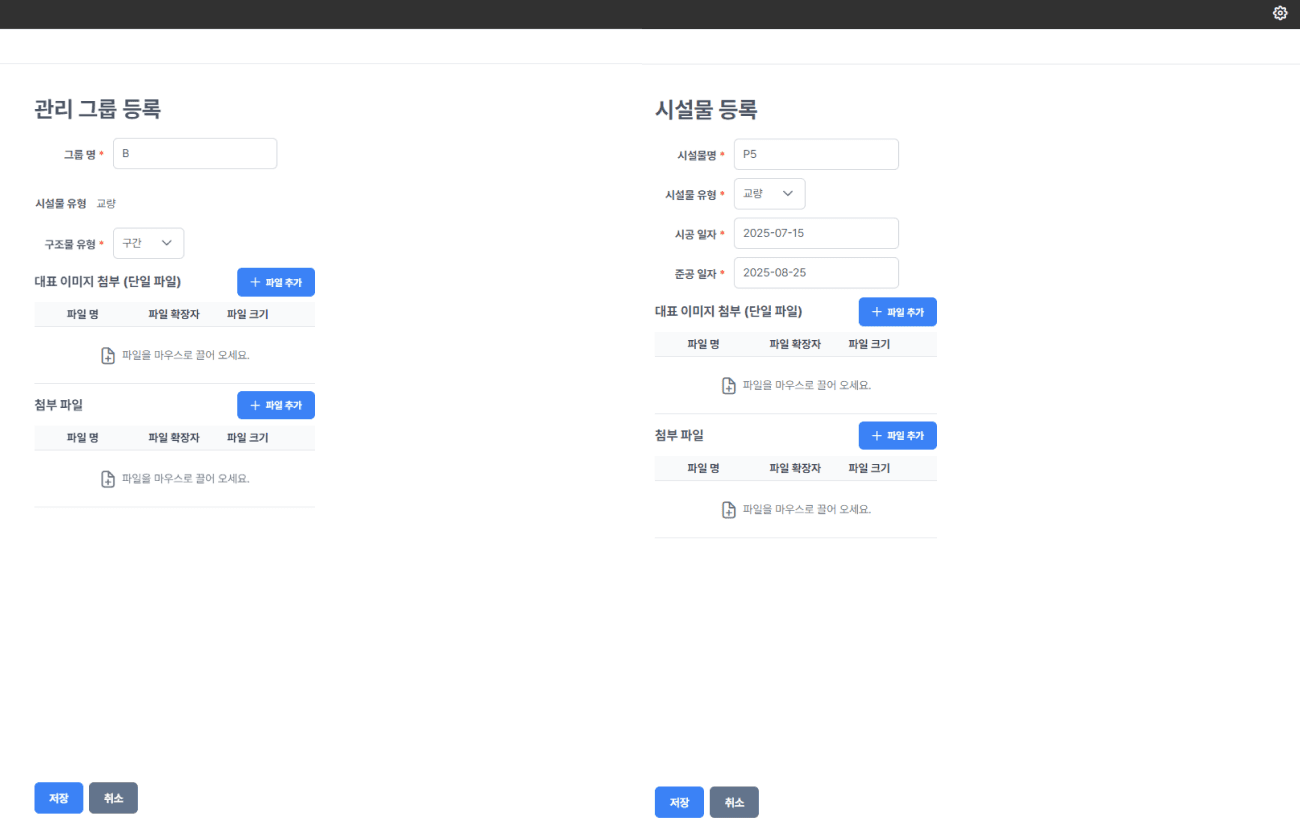
Universal Facility Type Management System DB Design
Project-based Management
Import existing drawings as-is and utilize them unit by unit through data integration.
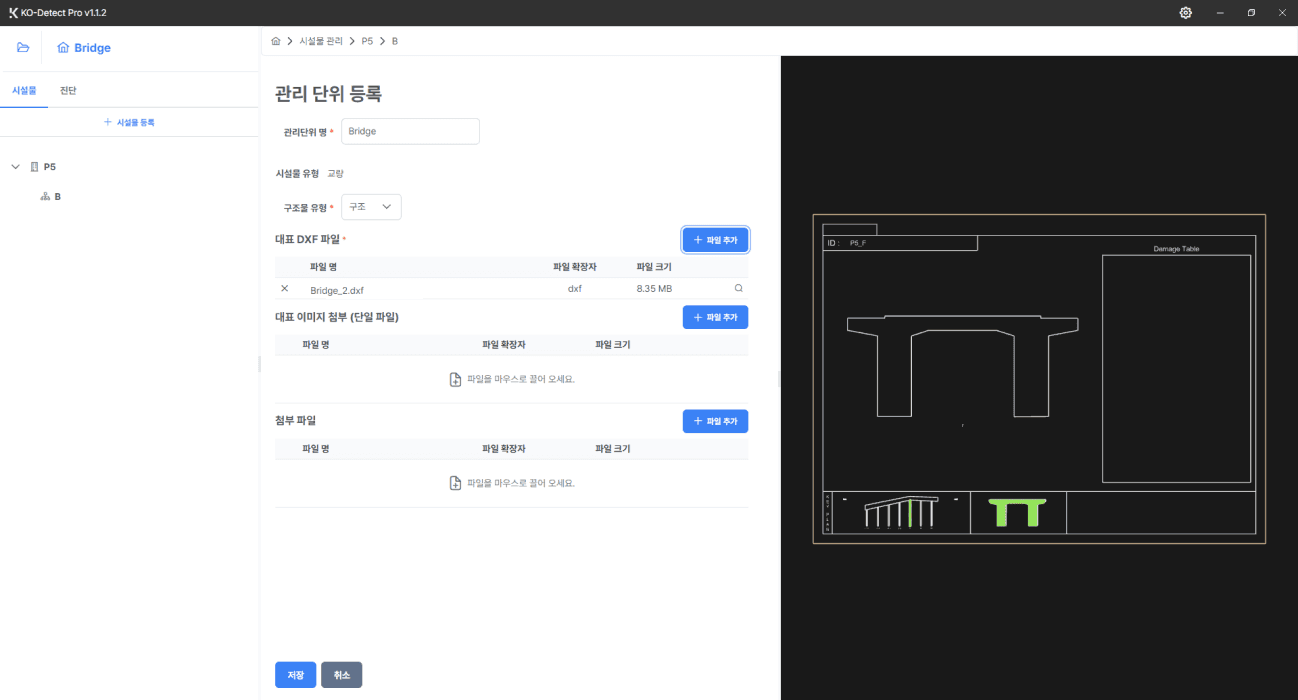
Existing Drawing Integration
Efficiently and easily utilize by linking existing drawing materials with data.
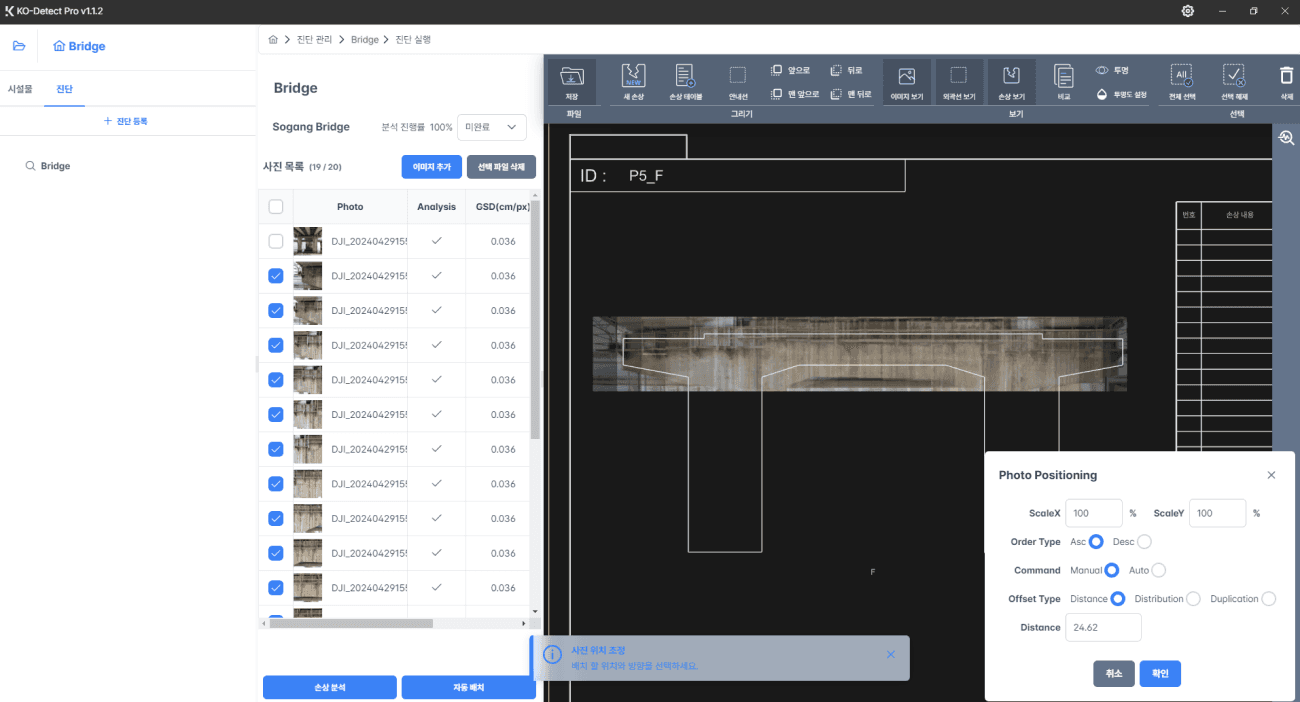
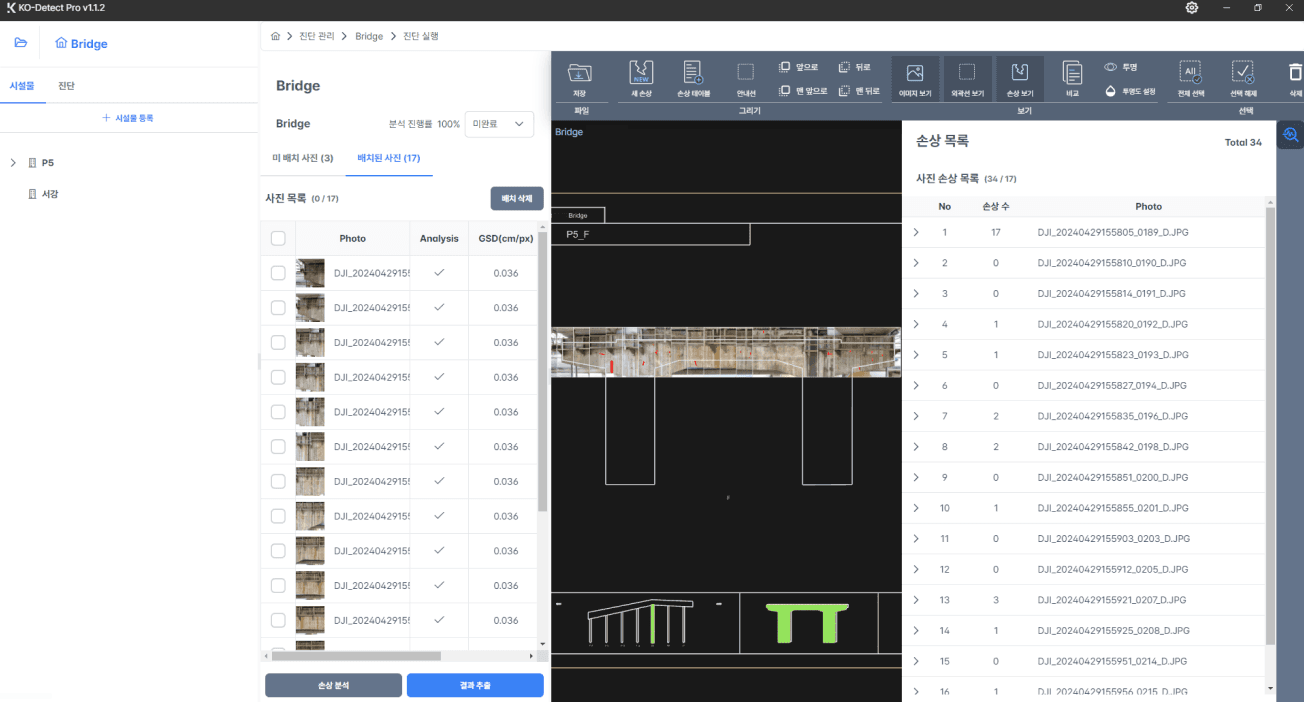
Auto & Manual Arrangement of Shooting Sequence Images
No Orthophoto Tool Required
Generate orthophotos instantly without separate programs.
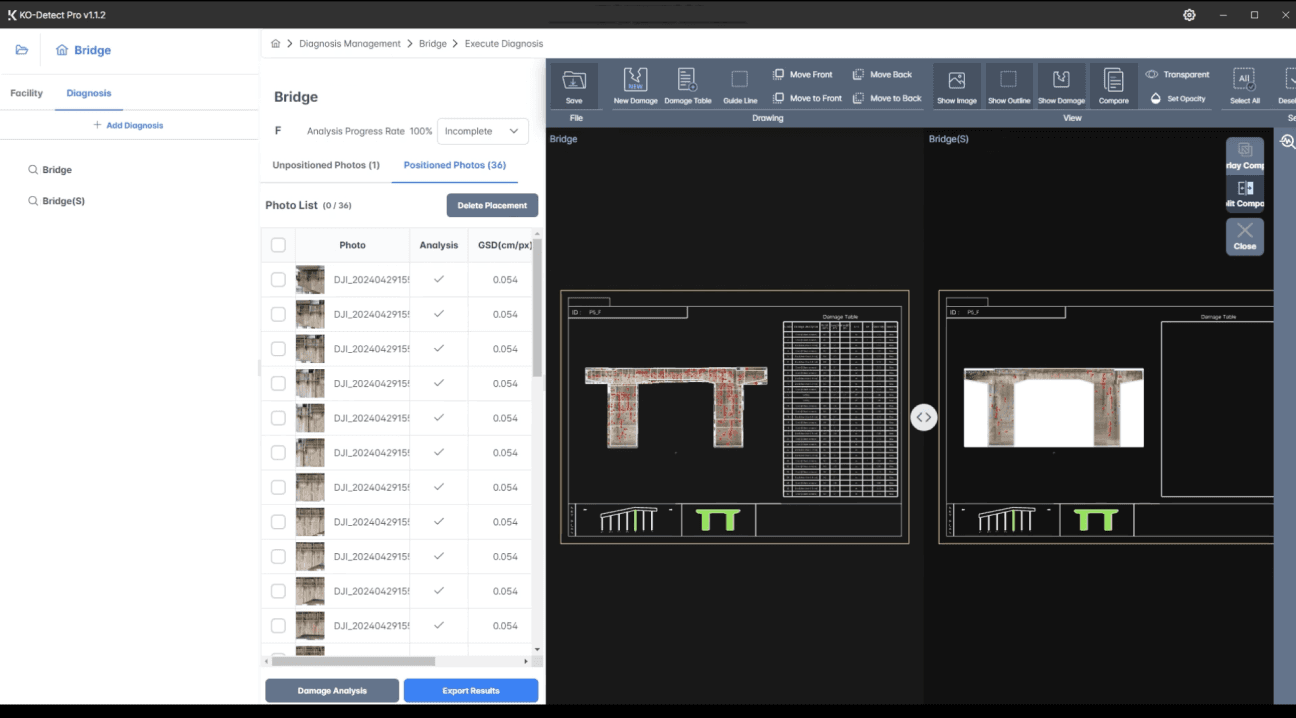
Time Series Analysis
Track damage progression by automatically comparing past data with current state.
Image-based Damage Detection & Quantification
Pixel Area Analysis to mm Unit Conversion
Confirm damage extent by analyzing pixel areas and converting to mm units.

Smart Damage Management
Automatically identify damaged areas by analyzing images and manage them with numerical representation.
Detection Result Editing & Drawing
Image-based CAD Optimization
Enable seamless large-capacity image work with image-based CAD optimization.
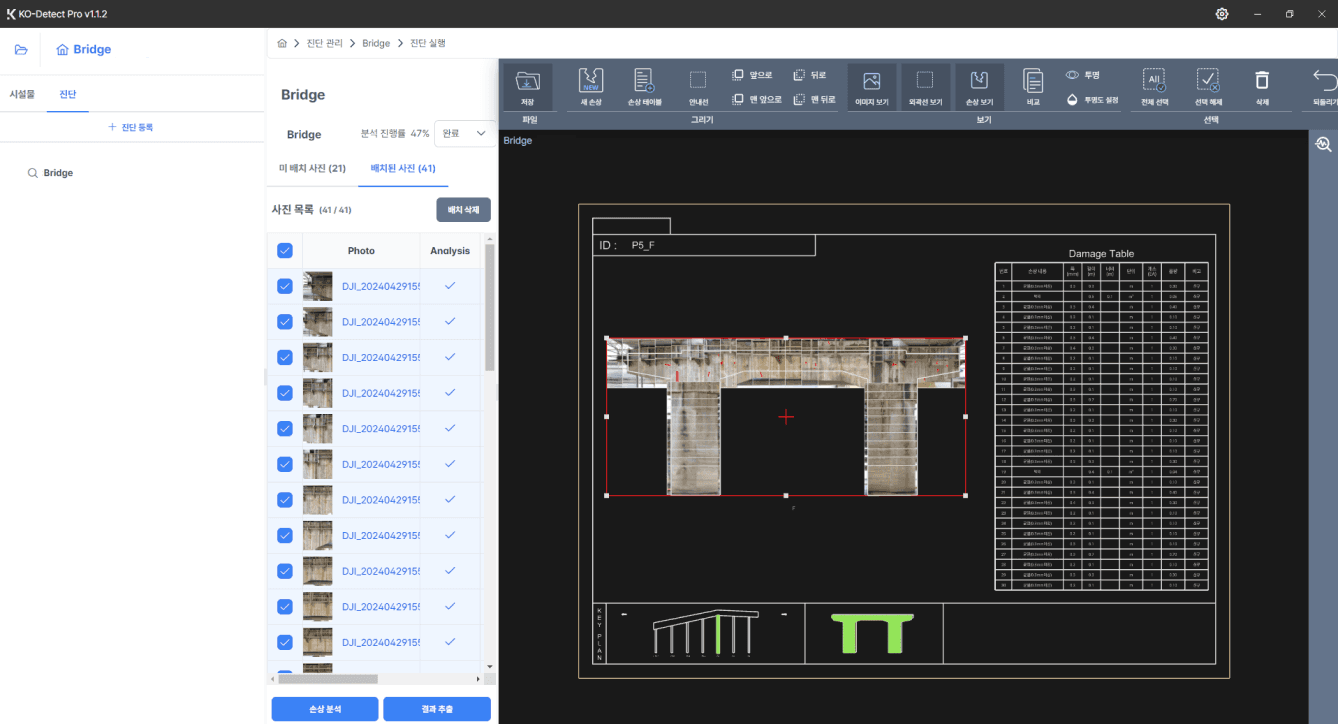
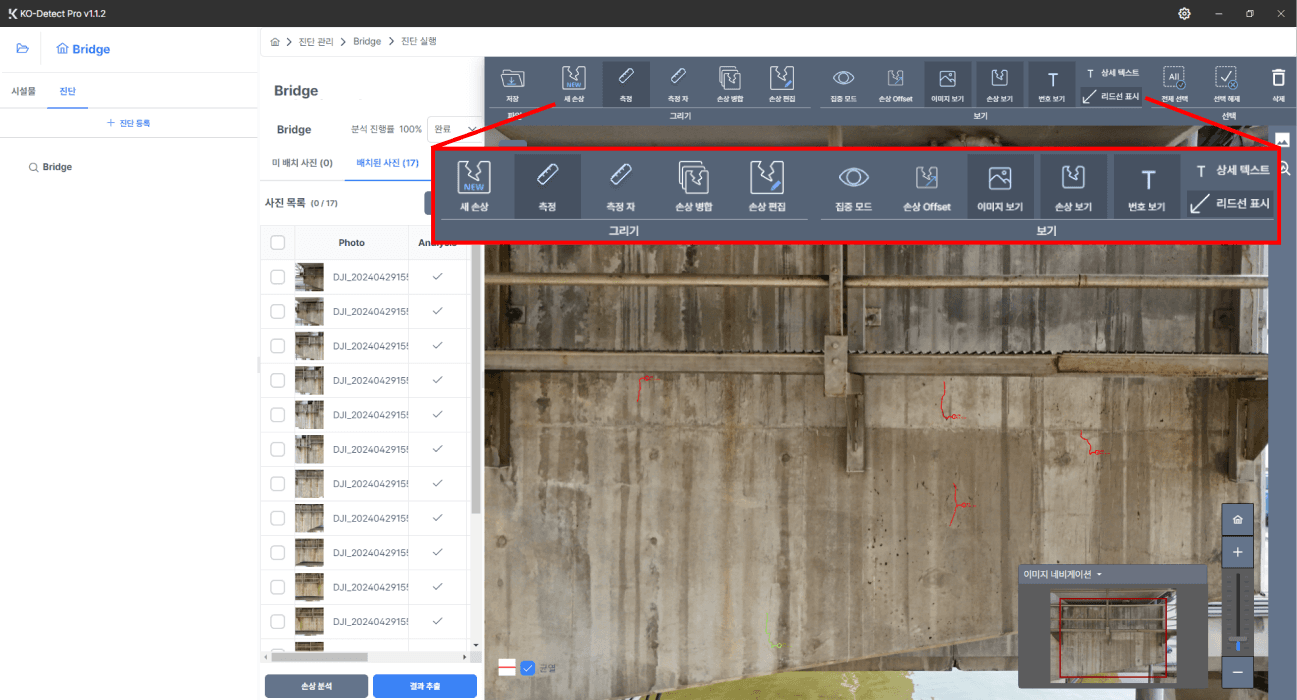
Safety Inspection Specialized Features
Intuitive editing that even non-experts can easily utilize with an intuitive interface and optimized features such as focus mode, damage offset, and damage number display.
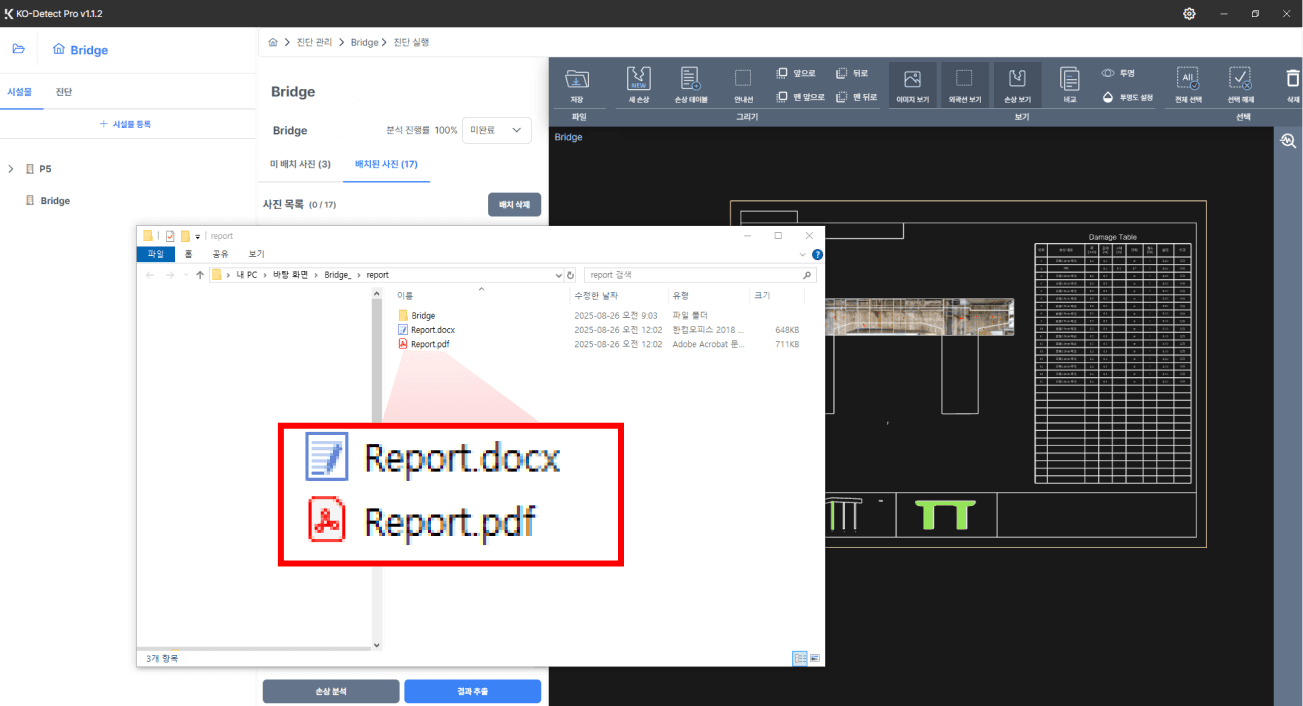
Automatic Report Generation
Automated Data Aggregation
Automatically aggregate key analysis data and provide in template formats such as PDF and Excel.
Evaluation Criteria Calculation and Trend Analysis
Establish facility safety judgment criteria based on data and identify risk signs in advance by analyzing change trends.
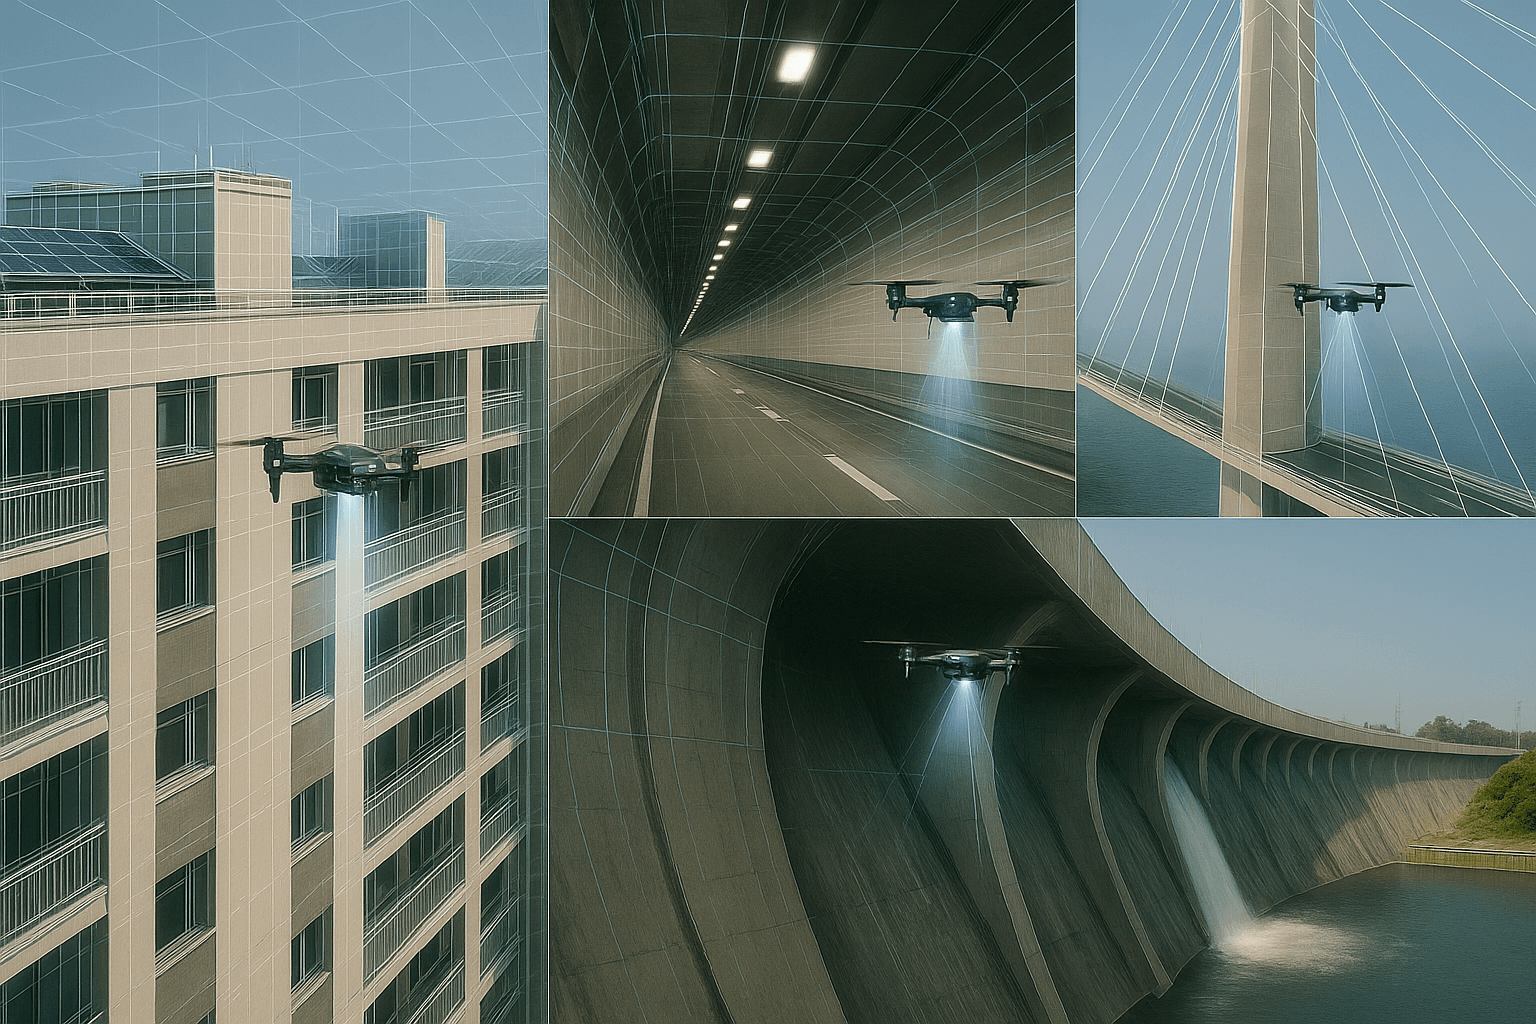
Apply KO-Detect Pro in various ways
.png&w=3840&q=75)
Building
When damage verification is needed through regular inspection, quickly check with drones.
.JPG&w=3840&q=75)
Bridge
Analyze various hard-to-reach inspection areas more precisely than the human eye
.png&w=3840&q=75)
Tunnel
Batch analyze even high-capacity images from scanners through AI
.png&w=3840&q=75)
Dam
Sensitive data security with local project management, no worry about leaks
.png&w=3840&q=75)
Road
Integrated inspection from surface to underground with image-based damage management
.png&w=3840&q=75)
Canal
Large-scale inspection with automatic flight shooting and automatic analysis
.png&w=3840&q=75)
Power Plant
Dangerous high-altitude work with remote inspection and systematic project management
.png&w=3840&q=75)
Port
Project management for bidirectional result verification between inspectors and managers
.PNG&w=3840&q=75)
Water Treatment Plant
High water tanks with remote inspection, automatic analysis, and maintenance request documentation